Gourav Dhiman
Monitoring and Alerting: Catching Problems Before Customers Do
By the time a customer emails to say your site is down, the problem has usually been building for a while. A disk slowly filling up over three days. A database connection pool creeping toward its limit. A third-party API getting slower response by response until it finally times out. None of these happen instantly, and every one of them leaves a trail before it becomes an outage. Monitoring and alerting exist to read that trail and act on it before a customer has to tell you something's wrong.
This sounds obvious stated plainly, and yet a huge share of teams still find out about production problems from a support ticket rather than a dashboard. This article covers what actually needs monitoring, how to build alerts that get acted on instead of ignored, and the practical mistakes that turn a good monitoring setup into background noise nobody trusts.
Why this matters more than it seems
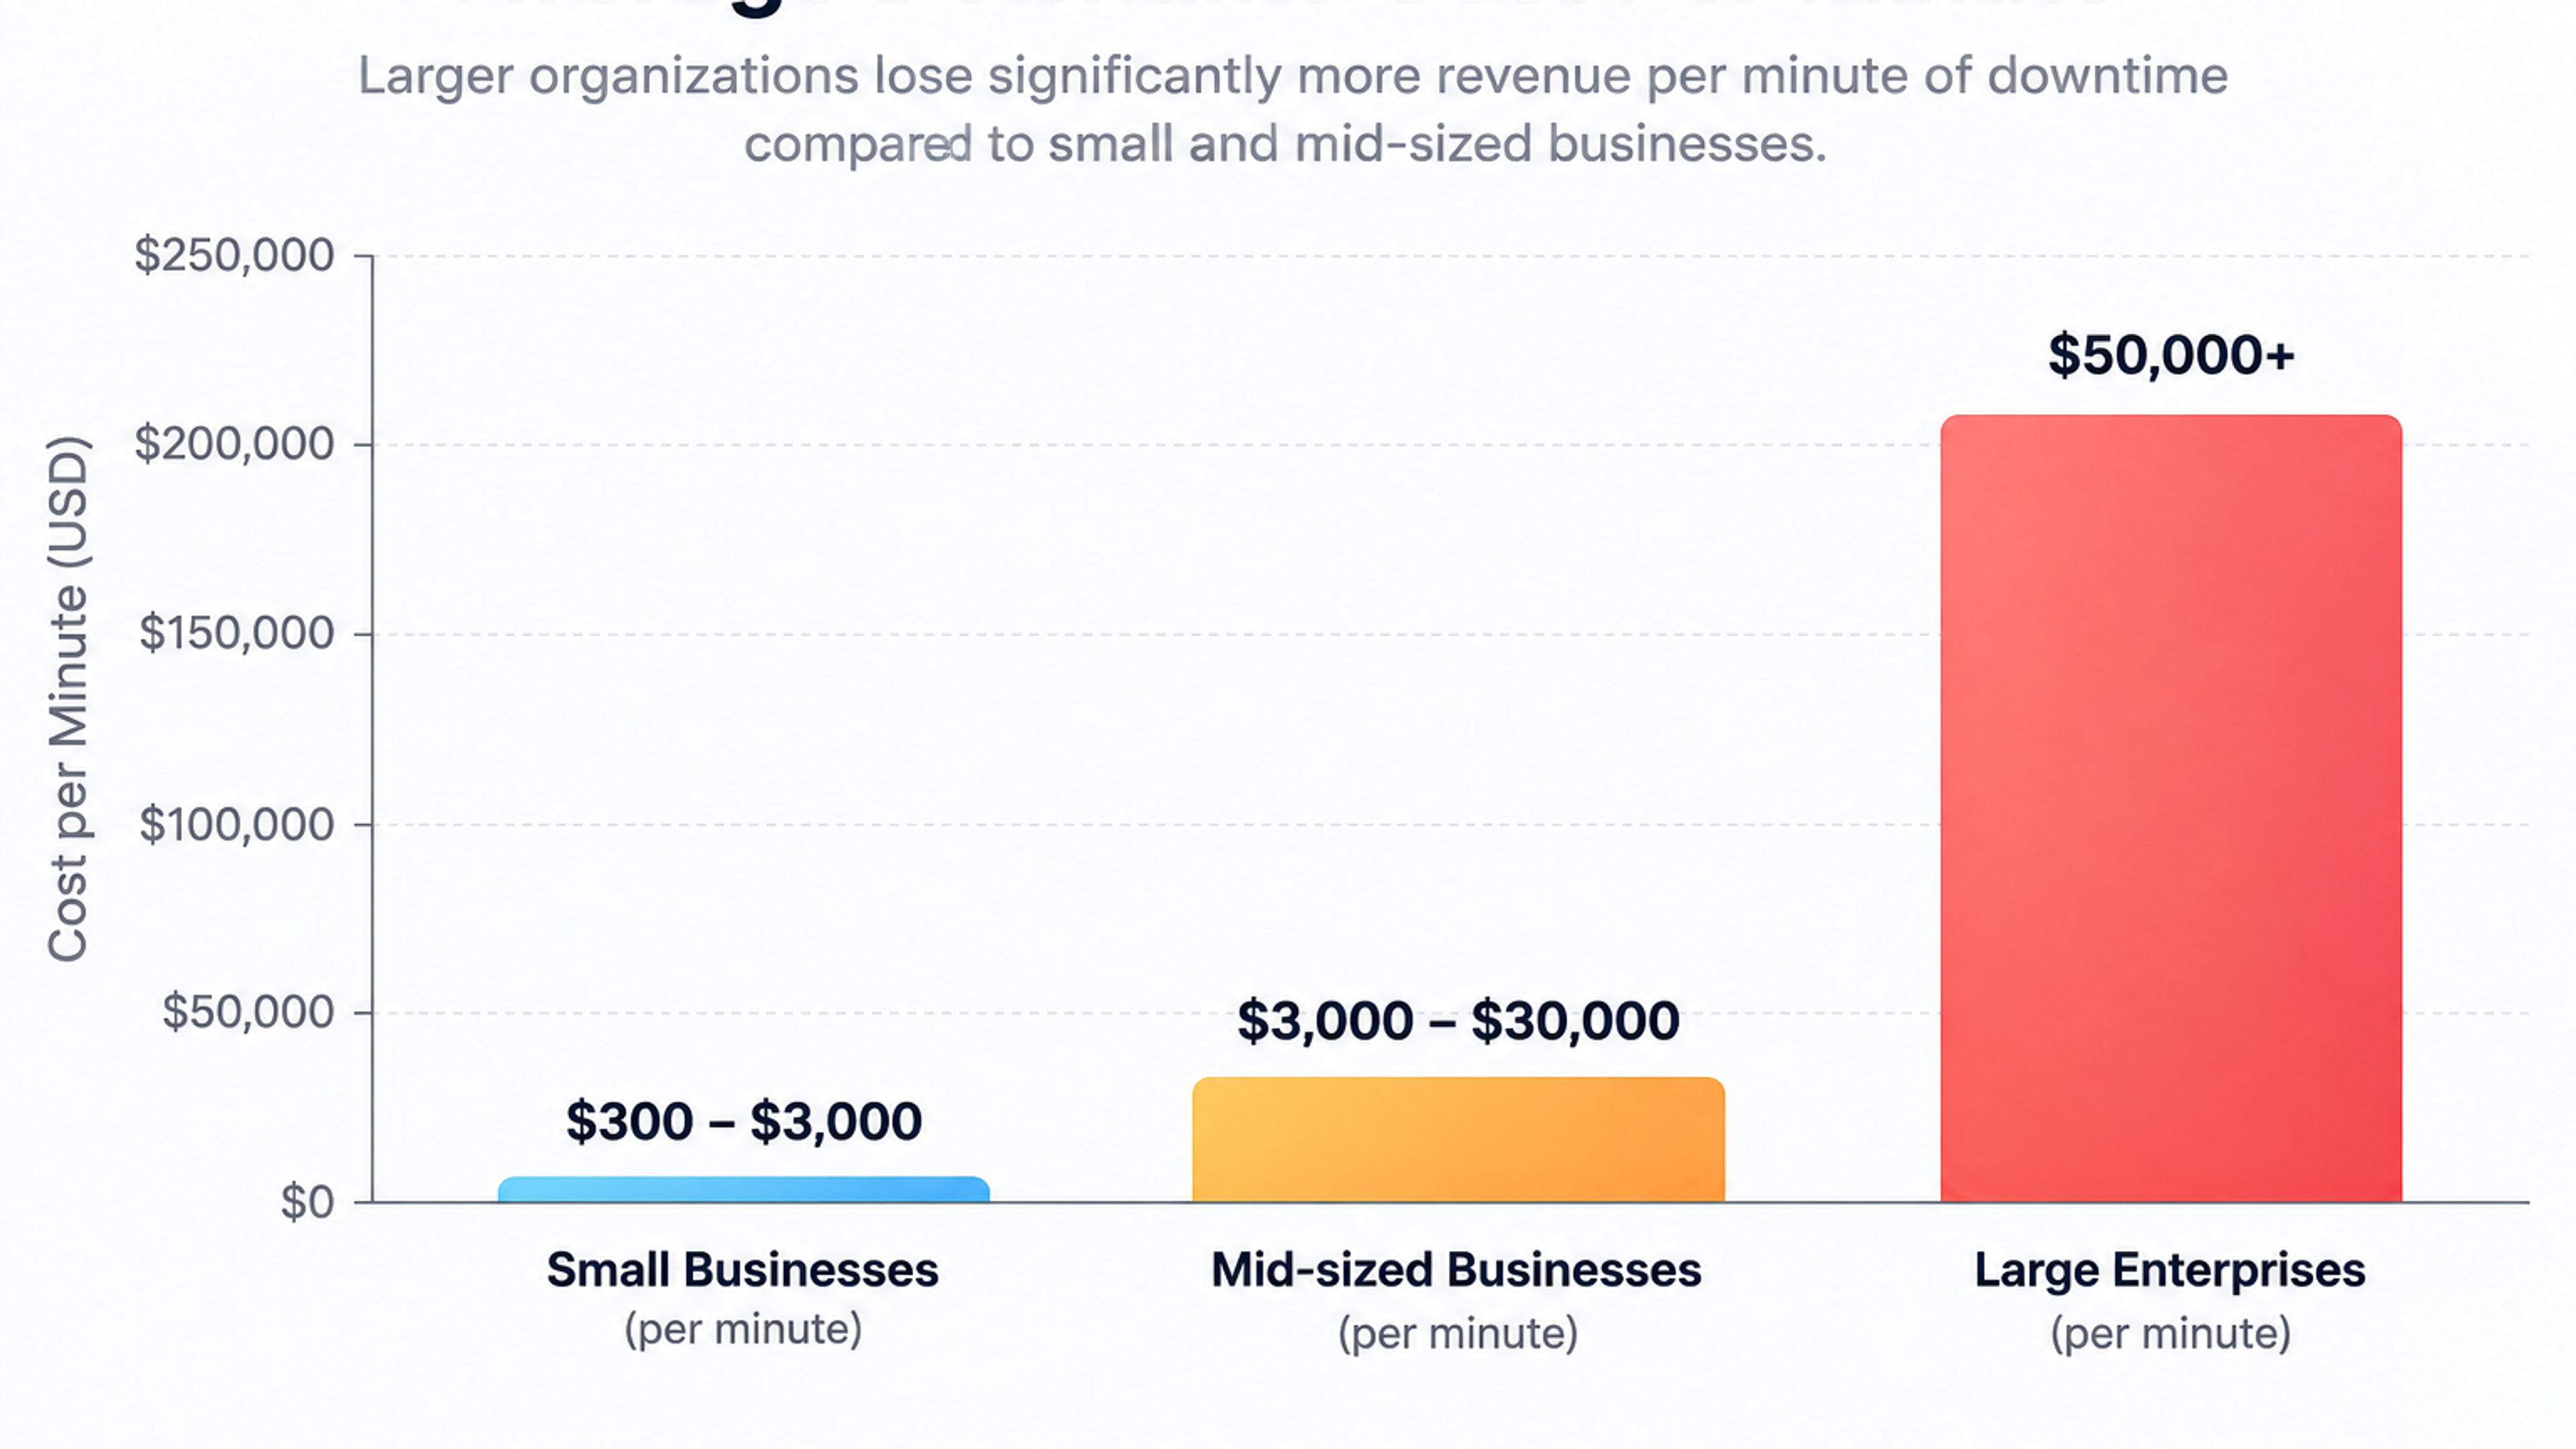
The financial case for catching problems early is not subtle once you look at the numbers, though it's worth noting upfront that downtime cost estimates vary widely across studies depending on company size, industry and methodology, from a few hundred dollars a minute for a small business up to tens of thousands per minute for large enterprises in transaction-heavy sectors like finance. ITIC's Hourly Cost of Downtime survey has found that the large majority of mid-size and large enterprises report downtime costs exceeding $300,000 per hour, and a meaningful share of large enterprises report costs running into millions per hour. Even at the small end of that range, an outage that runs for twenty minutes because nobody noticed for the first fifteen is a materially different event than one caught and mitigated in the first ninety seconds.
The gap between those two outcomes is entirely about detection speed, which is what monitoring and alerting are actually for. The industry shorthand for this is MTTD, mean time to detect, and MTTR, mean time to resolve. Good monitoring compresses MTTD toward zero by catching a degrading signal before it becomes a full failure. Good alerting compresses MTTR by getting the right information to the right person immediately, rather than leaving them to reconstruct what happened from scratch once they're paged.
What actually needs monitoring
It's tempting to think more monitoring is always better, but a dashboard with two hundred metrics on it is often less useful than one with the four or five that actually predict trouble. Google's Site Reliability Engineering team, one of the more widely cited references on this topic, distilled production monitoring down to four signals worth prioritizing above everything else: latency, traffic, errors and saturation, sometimes referred to as the golden signals.
Latency is how long requests take to complete, and the detail that trips people up most often is measuring it correctly. Average latency hides problems, because a handful of very slow requests get averaged away by a much larger number of fast ones. The practice worth adopting is tracking percentiles instead, particularly the 95th and 99th percentile, since those numbers reveal the experience of your slowest-served users, the ones most likely to notice something's wrong first. It's also worth tracking the latency of failed requests separately from successful ones, since a request that fails instantly and one that times out after thirty seconds represent very different problems even though both count as an error.
Traffic is simply how much demand is hitting your system, measured in whatever unit makes sense for what you run, requests per second for a web app, transactions per minute for a payment system, concurrent connections for a chat service. Traffic alone rarely triggers an alert, but it provides essential context for everything else. Rising latency alongside rising traffic usually means you're approaching a capacity limit. Rising latency on flat traffic usually means something broke, a slow query, a bad deploy, a degraded dependency, and those two situations call for completely different responses.
Errors are the most intuitive signal and the easiest to get wrong through raw counting. A jump from ten errors to a hundred looks alarming until you realize traffic also went up tenfold, meaning your error rate stayed flat. Tracking errors as a percentage of total requests, rather than a raw count, avoids false alarms during high-traffic periods and catches real problems during low-traffic ones that a raw count would understate.
Saturation measures how close a system is to its resource limits, CPU, memory, disk space, connection pool capacity, queue depth, and it deserves particular attention because it's the leading indicator among the four. Latency, traffic and errors tell you about problems happening right now. Saturation tells you about problems that are about to happen, days before they materialize as one of the other three signals. A disk filling up predictably over a week is a saturation problem you can schedule around. The same disk filling up and then failing is an outage you get woken up for.
What sits outside the four core signals
The golden signals cover the infrastructure and request-level view, but two additional categories matter for most businesses and are easy to overlook when monitoring is built purely by engineers for engineers.
External dependency health deserves its own attention separate from your own systems, since a payment processor, an email delivery service, or a third-party API you rely on can degrade without any change on your end, and your own dashboards may look perfectly healthy right up until the dependent call starts failing. Tracking the latency and error rate of your outbound calls to key dependencies, not just inbound requests to your own service, closes this blind spot.
Business-level signals are the layer most technical monitoring setups skip entirely, and they're often what actually matters to the business. A checkout flow can be technically healthy, low latency, no errors, full uptime, while conversion silently drops because a form field broke in a way that doesn't throw an exception. Monitoring a small number of business metrics alongside the technical ones, signups per hour, completed checkouts, successful logins, catches the category of problem that pure infrastructure monitoring is structurally blind to.
Turning signals into alerts people actually act on
Collecting the right metrics is only half the job. The other half, and the half most teams get wrong, is deciding when a metric crossing a line should actually interrupt a human being.
Alert on symptoms, not just causes
A common mistake is alerting on every possible internal cause, high CPU, a slow query, a full disk, rather than on the customer-facing symptom those causes eventually produce. The problem with cause-based alerting is that the same customer-facing symptom, slow page loads, can have a dozen different internal causes, and building a separate alert for each one means constant tuning and constant gaps. Alerting primarily on the golden signals themselves, latency crossing a threshold, error rate crossing a threshold, catches the symptom regardless of which underlying cause produced it, and the investigation that follows is where you find the specific cause. Cause-level alerts still have a place, particularly for saturation, where catching a slowly filling disk before it becomes a symptom is exactly the point, but they shouldn't be the majority of what pages someone at 3 a.m.
Set thresholds against a baseline, not a guess
An alert threshold picked out of thin air, "page someone if CPU exceeds 80 percent", often turns out to be either far too sensitive for a system that normally runs at 85 percent during business hours, or far too loose for one that never exceeds 40 percent unless something is genuinely wrong. Building thresholds from a few weeks of real baseline data, then setting the alert meaningfully above normal variance rather than close to it, produces alerts that fire because something changed, not because the system is simply doing what it always does at 2 p.m. on a Tuesday.
Match alert severity to actual urgency
Not every anomaly deserves to wake someone up. A workable severity structure distinguishes between conditions that need immediate human response, things actively affecting customers right now, and conditions worth knowing about that can wait for the next business day, like a slowly growing disk with a week of runway left. Routing the first category to a phone call or page and the second to a dashboard or a daily digest keeps the urgent channel reserved for things that are actually urgent, which is the single biggest factor in whether people keep trusting and responding to alerts at all.
Give every alert enough context to act on immediately
An alert that says only "error rate high" forces whoever receives it to spend the first several minutes just figuring out what's happening before they can start fixing anything, and that reconstruction time is pure waste that a better-designed alert would have eliminated. A good alert states which service is affected, what threshold was crossed and by how much, links directly to the relevant dashboard or logs, and where possible, notes what changed recently, a deploy, a config change, a traffic spike, that might be the cause. The difference between a bare threshold alert and a well-contextualized one often accounts for a meaningful chunk of total resolution time, since it's the gap between "start investigating from zero" and "start investigating from a reasonable hypothesis."
The problem that quietly undermines all of this: alert fatigue
None of the above matters if people stop paying attention to alerts, and that's exactly what happens when a monitoring setup generates too many alerts that turn out not to matter. Once someone has been paged three times in a week for conditions that resolved themselves or weren't actually urgent, the natural human response is to start treating pages as background noise, glancing at them without full attention, or silencing them entirely during busy periods. The next alert after that pattern sets in might be the one that actually mattered, and it gets the same reduced attention as the false alarms before it.
This is why a smaller number of well-tuned alerts consistently outperforms a larger number of loosely configured ones. Every alert that fires and turns out to be nothing is a withdrawal from a limited trust account, and rebuilding that trust after it's depleted takes far longer than building it carefully in the first place. Reviewing which alerts fired over the past month, how many required real action versus how many were noise, and either fixing the threshold or removing the alert entirely for the ones dominated by noise, is unglamorous maintenance work that pays for itself directly in whether the team still trusts the system.
Setting expectations with SLOs and error budgets
A related concept worth adopting, particularly once a team has the golden signals in place, is defining a service level objective, an explicit target like "99.9 percent of requests complete successfully within 300 milliseconds," rather than treating every deviation from perfect as equally alarming. An SLO gives you an error budget, the small amount of allowed failure built into that target, and that budget reframes a lot of monitoring decisions. A brief latency blip that stays well within the budget doesn't need a page. A pattern that's steadily consuming the budget faster than expected does, even if no single moment within it looks dramatic on its own.
This matters because pure threshold-based alerting treats every crossing of a line the same way regardless of how much it actually matters to the overall reliability target, while an SLO-based approach distinguishes between noise that doesn't threaten the target and a genuine trend that does. Teams that adopt this tend to find their overall alert volume drops meaningfully, because a lot of what used to trigger a page turns out to be well within acceptable variance once there's an actual target to measure against.
Common mistakes worth avoiding
A few patterns show up repeatedly in monitoring setups that look complete on paper and fail in practice. Monitoring only what's easy to measure rather than what actually matters is the most common, since infrastructure metrics like CPU and memory are simple to collect but don't always correlate with what customers experience, while the business-level signals that would catch a broken checkout flow require more deliberate setup and get skipped as a result.
Setting up monitoring once and never revisiting it is close behind. A threshold that made sense when the system handled a thousand requests a day becomes meaningless noise once it handles a hundred thousand, and a monitoring setup that isn't periodically reviewed against current traffic patterns drifts out of usefulness quietly, the same way an unattended alert channel drifts into being ignored.
No clear ownership of who responds to what turns even a well-designed alert into a delay, since an alert that fires into a channel nobody's specifically responsible for checking is functionally the same as no alert at all. And treating monitoring as a purely technical concern, built by and for engineers with no visibility into business impact, means the people making product and operational decisions are often the last to know something's degrading, even when the technical team caught it hours earlier.
Where to start if you're building this from nothing
A team with no monitoring in place doesn't need a comprehensive observability platform on day one. Start with the four golden signals on your most customer-critical service, set thresholds from a couple of weeks of real baseline data rather than guesses, and route only the genuinely urgent conditions to an immediate page while everything else goes to a dashboard someone checks daily. Add business-level metrics for your single most important user flow once the technical layer is stable. Review what actually fired every month or two, and be willing to delete alerts that never turn out to matter. This gets most of the real benefit, catching problems before customers report them, without the overhead of a system so elaborate that maintaining it becomes its own job.
Frequently Asked Questions
The scale of the setup should match the scale of the business, but the underlying principle applies even to a small operation. A small e-commerce site doesn't need Google-scale observability infrastructure, but knowing within minutes rather than hours that checkout is failing is valuable regardless of company size, and the golden signals framework scales down perfectly well to a modest setup.
A quarterly review is a reasonable baseline for most teams, though any major change in traffic volume, a new feature launch, or a period where alerts clearly stopped matching reality is worth an out-of-cycle review rather than waiting for the scheduled one.
No. Reserving immediate paging for conditions genuinely affecting customers right now, and routing everything else to a dashboard or a daily summary, is one of the most effective ways to prevent alert fatigue and keep the urgent channel meaningful.
Monitoring typically refers to watching predefined metrics and dashboards for known failure conditions. Observability is the broader ability to ask new questions about a system's behavior after the fact, using logs, traces and metrics together, which matters most when an incident's cause wasn't something you thought to monitor for in advance.
There's no universal number, but starting narrow, the golden signals for your most critical service plus one or two business metrics, and expanding deliberately based on what actually turns out to matter, produces a far more trustworthy system than starting broad and trying to tune down noise later.