Aisha Sharma
When an application feels slow, the database is the culprit more often than most teams expect.
A page that waits on a handful of unoptimized queries cannot be rescued by faster front-end code, a bigger server, or a better CDN. Database optimization is the work of making sure the data layer answers quickly, consistently, and without collapsing when traffic rises. Done well, it shortens response times, lowers cloud bills, and makes every other performance improvement more effective.
This guide explains where database time goes in a typical request, how to find the queries that actually matter, and which fixes deliver the most return: indexing, better query design, schema choices, connection management, caching, and scaling. It also covers where cloud infrastructure and security settings affect performance, since those topics are usually treated separately and shouldn't be. The examples lean toward PostgreSQL and relational databases, but the principles carry over to MySQL and most other systems.
How the Database Sets Your Application's Speed Limit
Every dynamic request follows a chain: the browser sends a request, the application server receives it, the application runs code and queries the database, then it builds a response and sends it back. The database sits in the middle of that chain, and its time adds directly to what the user feels.
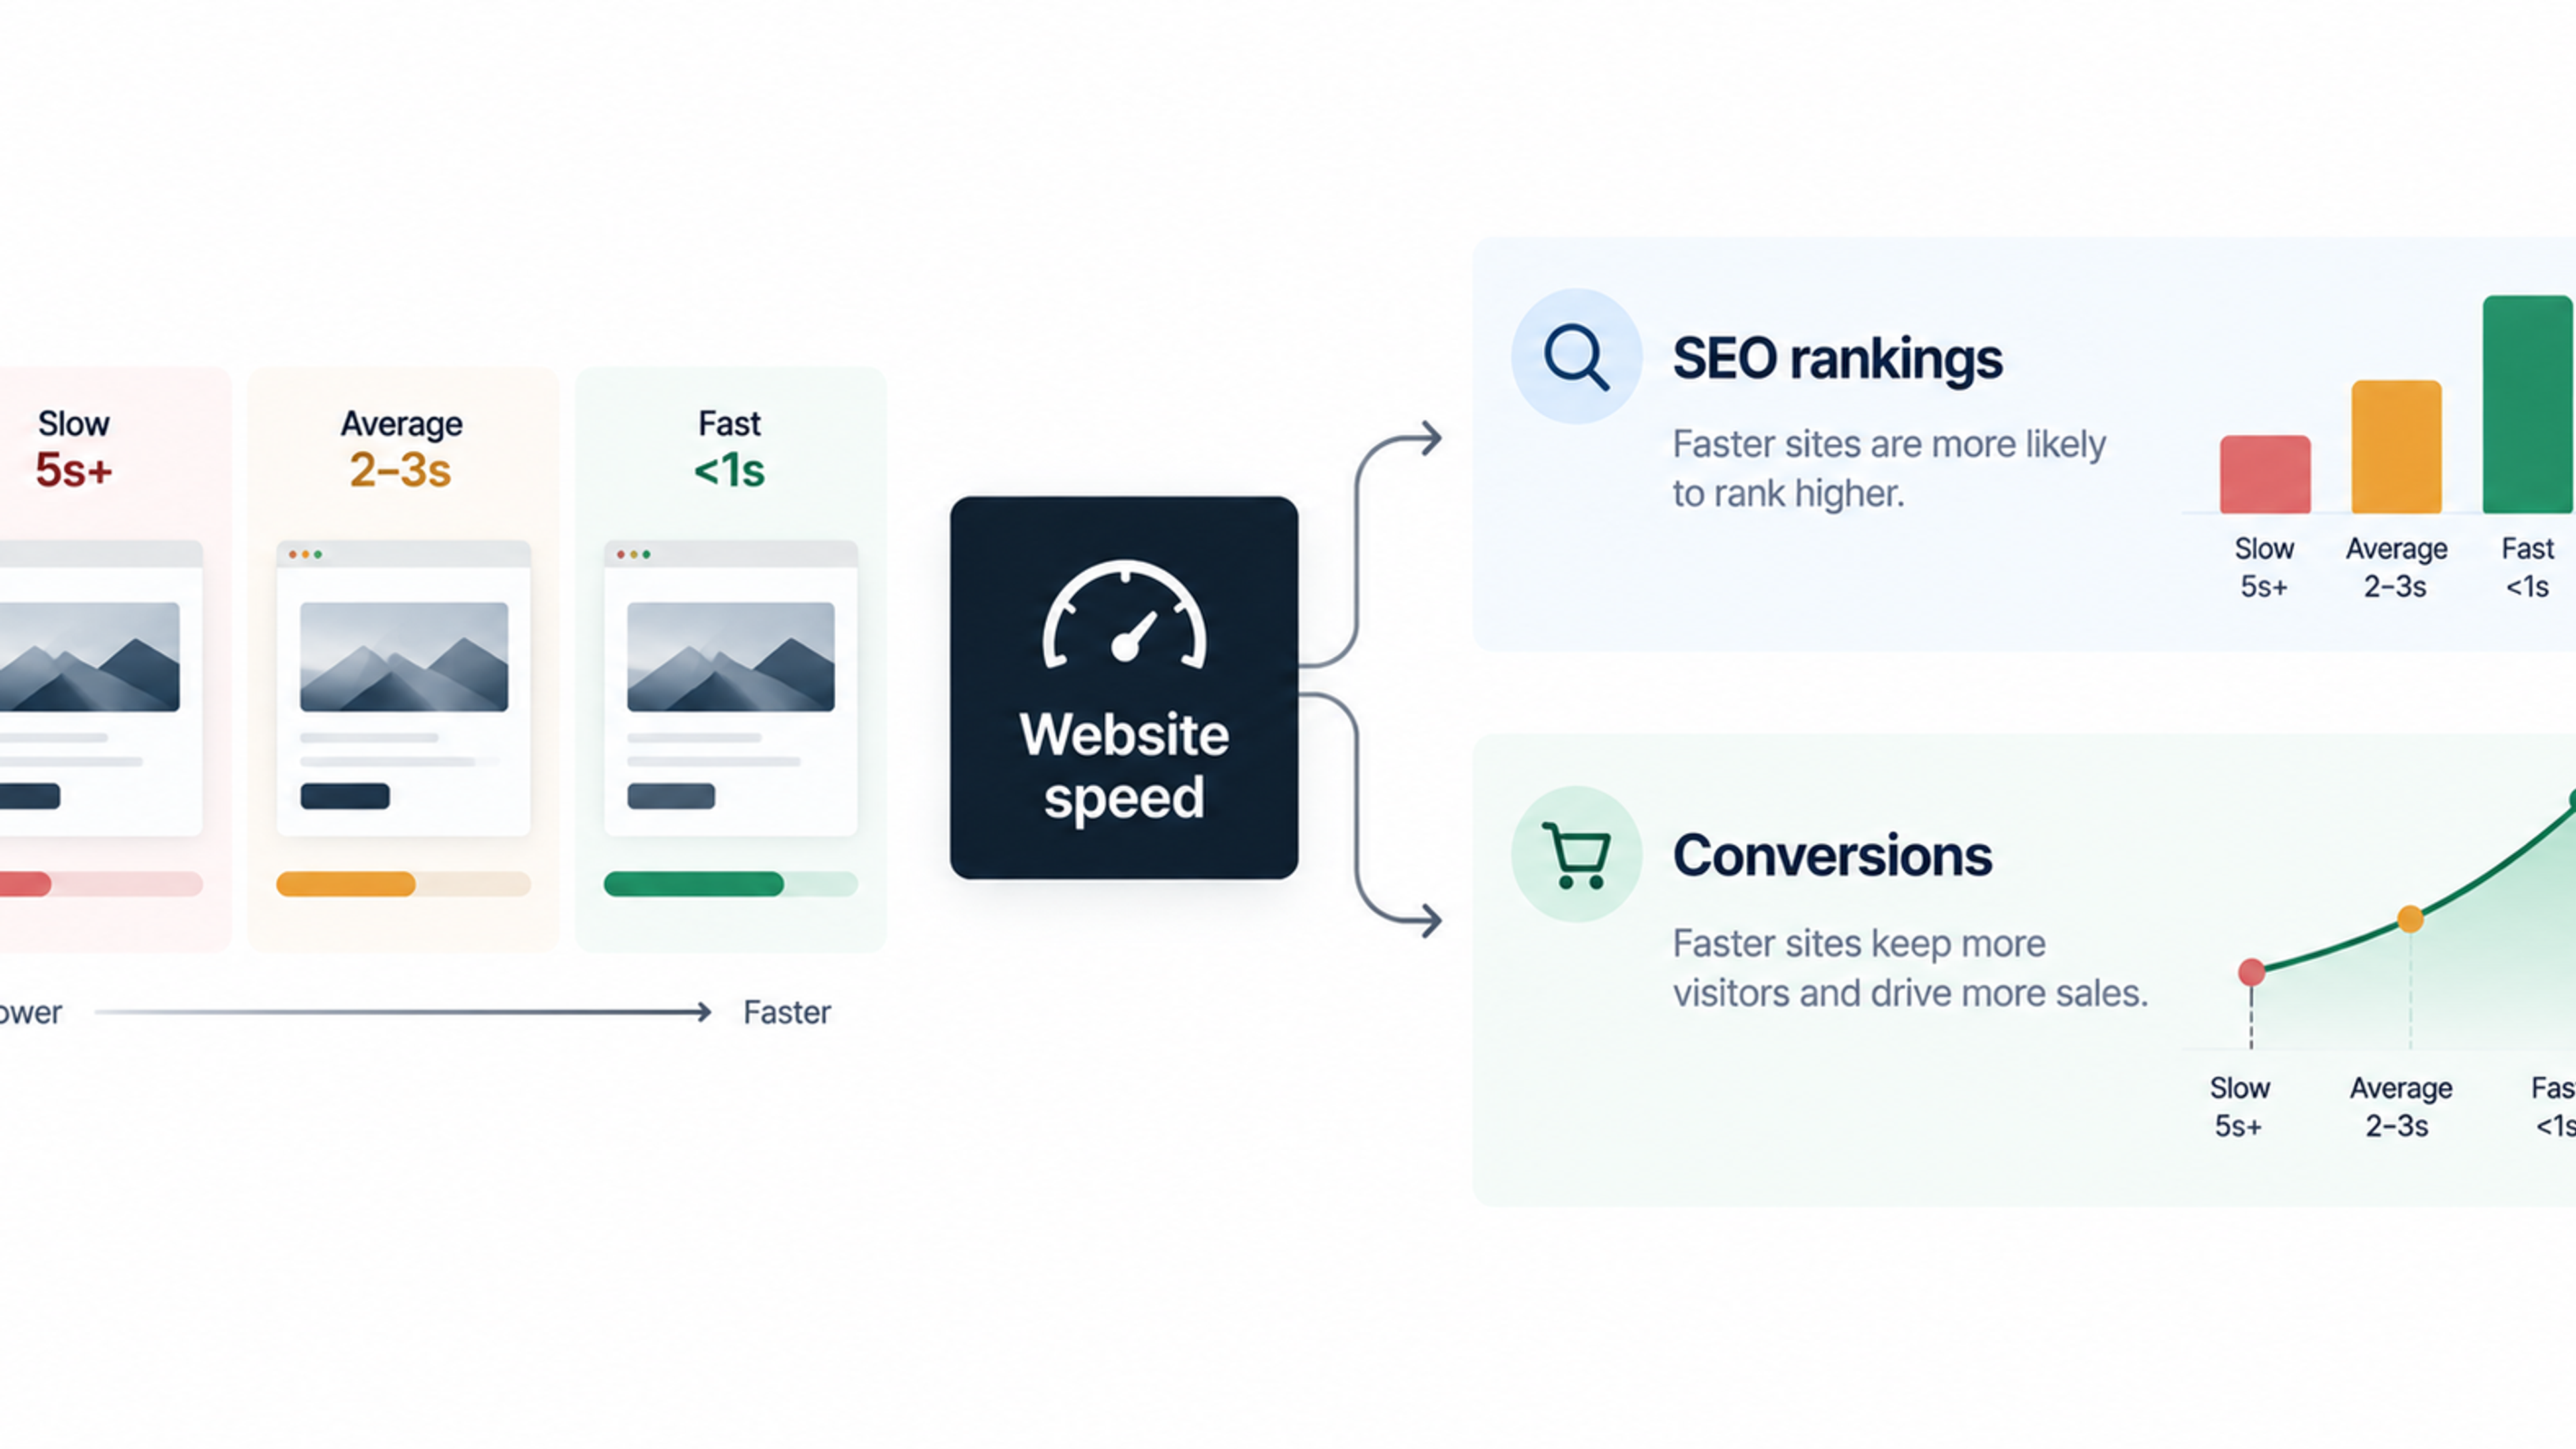
The most common way to measure this from the outside is Time to First Byte, or TTFB, which captures how long the browser waits before the first piece of the response arrives. Google's web performance guidance treats a TTFB of 800 milliseconds or less as good and anything above 1,800 milliseconds as poor. Slow database work is one of several contributors, along with network distance, TLS setup, and application code, but for data-heavy pages it is often the largest. One technical SEO reference notes that slow queries, missing indexes, and N+1 problems tend to dominate server processing time. Because TTFB feeds into Largest Contentful Paint, a slow data layer can also drag down the Core Web Vitals scores that influence search visibility. As one performance glossary puts it, a slow TTFB makes a good LCP nearly impossible.
Two characteristics of databases make them especially important to performance. First, they are shared resources. A single slow query does not just slow one user, it consumes CPU, memory, disk reads, or locks that other queries need. Second, database problems grow with data. A query that is fine with 10,000 rows can become painfully slow at 10 million, which is why applications often feel fast at launch and sluggish a year later without a single line of code changing.
Measure Before You Optimize
The most common mistake in database tuning is guessing. A developer remembers an unwieldy-looking query, rewrites it, and discovers it was never the bottleneck. Start with evidence.
Find the queries that cost the most
Enable slow query logging so the database records anything exceeding a threshold. In PostgreSQL, a common technique is to log statements that run longer than a chosen duration, such as 100 milliseconds, using the log_min_duration_statement setting. Pair that with the pg_stat_statements extension, which aggregates statistics across every execution of each query shape. MySQL has an equivalent slow query log, and managed cloud databases usually expose similar views through their consoles.
Sort the results two ways. By average duration, you find the individually slow queries. By total time, which multiplies duration by call count, you find the ones that consume the most database capacity overall. A query that takes 5 milliseconds but runs 40,000 times a minute is a bigger problem than one that takes two seconds and runs twice a day. One practical guide recommends ordering by total execution time to surface the heaviest queries, and using EXPLAIN with timing and buffer details on each candidate.
Look at tail latency, not just averages
Averages hide pain. If the typical request takes 120 milliseconds but one in a hundred takes four seconds, users notice the slow ones, and those are usually the requests hitting an unindexed filter or a lock. Track the 95th and 99th percentile response times for your key endpoints, and tie them to the queries those endpoints run. Application performance monitoring tools can show a trace of each request with the exact queries and durations, which makes this connection much easier.
Read the query plan
Once you have a suspect query, ask the database how it executes it. In PostgreSQL, the EXPLAIN command shows the plan the optimizer chose, and EXPLAIN ANALYZE runs the query and reports actual timing at each step. A tutorial on the topic points out that EXPLAIN reports estimated costs from collected statistics, while EXPLAIN ANALYZE executes the query and shows real processing time per stage. That distinction matters in practice: ANALYZE actually executes the statement, so for queries that modify data, wrap them in a transaction you can roll back, and be careful on production systems.
When reading a plan, look for a few signals. A sequential scan on a large table where you expected an index lookup. A large gap between estimated and actual row counts, which suggests stale statistics. A sort or hash that spills to disk. Nested loops running thousands of times. You do not need to understand every node to find the expensive one: the step with the largest actual time is where to focus.
Indexing: The Highest-Return Fix, Used Carefully
An index is a separate data structure that lets the database find rows without scanning the whole table, much like a book index sends you to the right page. For most applications, missing or poorly designed indexes cause more slowdowns than anything else, and adding the right one can turn a query that takes seconds into one that takes milliseconds.
What to index
Start with the columns your queries use to find and connect rows: the ones in WHERE clauses, JOIN conditions, and ORDER BY clauses on frequently run queries. Foreign key columns are a classic oversight. Many databases do not index them automatically, so a join or a cascading delete can end up scanning an entire table.
Composite indexes and column order
When a query filters on more than one column, a composite index covering both can be far better than two separate ones. Order matters. A multicolumn B-tree index is most efficient when queries constrain its leading columns, so put columns used with equality comparisons first and range conditions after. An index on (customer_id, created_at) serves a query for one customer's recent orders very well. It does little for a query that filters only on created_at. One tutorial demonstrates this by showing that an index with the columns in reversed order was not used by the same query. Design indexes around the actual queries, not the table in general.
Partial, expression, and covering indexes
A partial index covers only the rows that match a condition, such as unprocessed jobs or active accounts, so it stays small and fast. An expression index handles queries that apply a function to a column. This matters because a plain index on email will not help a query written as WHERE LOWER(email) = 'x', but an index on LOWER(email) will. A covering index includes extra columns so the database can answer a query from the index alone, avoiding trips to the table.
The cost side
Indexes are not free. Every insert, update, or delete must also update each affected index, which slows writes and consumes storage and memory. A practical troubleshooting guide lists too many indexes as a common mistake, noting that writes slow down because every insert updates all of them. The goal is not to index everything but to index what your real queries need and drop indexes that no query uses. PostgreSQL's usage statistics can show which indexes are never scanned.
Query Design: Where Application Code Meets the Database
Even with perfect indexes, poorly written queries can ruin performance. Many of these problems come from the application layer, particularly from ORMs, which make database access convenient while hiding what is actually executed.
The N+1 query problem
This is the most common ORM-related slowdown. The application runs one query to fetch a list, then one additional query for each item to load related data. As one explanation puts it, the N+1 pattern occurs when a query runs for every result of a previous query, so 1,000 results means 1,001 queries. Each individual query may be fast, but the cumulative round trips add up, especially when the database is on a separate server and every query pays network latency.
The cause is usually lazy loading, where related records are fetched only when accessed. Some frameworks default to it, and the same source notes that Ruby's ActiveRecord uses lazy loading by default. The fix is to load related data up front, using eager loading, a join, or a batched fetch, so the whole page needs a few queries instead of hundreds. Counting queries per request in development is a simple way to catch regressions early.
Other patterns that quietly cost time
Selecting every column when the page needs three wastes memory and network bandwidth and prevents covering indexes from helping. Loading whole tables with no limit is just as common: one query optimization guide flags calling an ORM's find-all method without pagination, which loads entire tables into memory when the user sees 20 rows.
Deep pagination with OFFSET gets slower as the offset grows, because the database must read and discard all skipped rows. For large lists, keyset pagination, which asks for rows after the last one seen, stays fast at any depth.
Wildcard searches that begin with a percent sign, such as LIKE '%term', cannot use a standard B-tree index. For search features, consider PostgreSQL's trigram indexes or full-text search, or a dedicated search engine if requirements grow.
Type mismatches can also silently disable indexes. Comparing a text column to a number, or a date column to a string in an unexpected format, may force a conversion on every row.
Writing data one row at a time is another frequent issue in imports and background jobs. Batch inserts and updates, wrapped in sensible transactions, are dramatically faster than thousands of individual statements.
Finally, use parameterized queries. They protect against SQL injection, which is a security necessity, and they also let the database reuse query plans rather than re-parsing near-identical statements. Here security and performance point the same way.
Schema Design and Data Maintenance
Query tuning only goes so far if the underlying structure fights you.
Choose data types deliberately
Smaller, appropriate types mean more rows per page, better caching, and smaller indexes. Use integers for IDs rather than text, proper date and timestamp types instead of strings, and fixed precision for money. Storing everything as large text or untyped JSON feels flexible but makes filtering and indexing harder.
Normalize first, denormalize with evidence
A well-normalized schema avoids duplication and keeps data consistent. For read-heavy pages that join many tables, it can be worth denormalizing selectively, for example storing a precomputed order total or a counter. Do this when measurements show a need, and plan how the duplicated data stays correct, because every copy is another thing to keep in sync.
Keep statistics and storage healthy
The query planner depends on statistics about your data to choose good plans. After large data changes, stale statistics can cause poor choices. PostgreSQL's autovacuum normally handles this and also reclaims space from dead rows, but heavy update workloads, long-running transactions, or misconfigured settings can leave tables bloated and slow. Check that autovacuum is keeping up, and run ANALYZE manually after bulk loads. Another practical note from troubleshooting guides is to refresh planner statistics manually after bulk inserts or updates.
Partition and archive old data
Tables that grow indefinitely, such as logs, events, and audit trails, eventually dominate storage and slow everything that touches them. Partitioning by time lets queries skip irrelevant ranges and makes dropping old data a cheap operation. Even without partitioning, an archiving policy that moves old records to cheaper storage keeps the active working set small. The key idea is that a database performs best when the data it uses frequently fits in memory.
Connections, Concurrency, and Locks
Not all slowness is about queries. How the application connects to the database, and how transactions interact, matters too.
Connection pooling
Opening a database connection is expensive, and each open connection consumes memory on the server. PostgreSQL in particular does not handle large numbers of connections gracefully. A Percona explainer notes that every idle session still uses memory, and too many can overload the server without warning. A managed database provider's documentation similarly states that having too many direct connections degrades performance.
The usual solution is a pooler such as PgBouncer or a managed equivalent, which sits between the application and the database and shares a small number of real connections among many clients. This matters most in modern deployments: serverless functions, auto-scaling containers, and many application instances can each open their own connections, quickly exhausting limits. If you see errors about too many clients, or CPU spikes from connection churn, pooling is the first thing to check. Be aware that some pooling modes affect session-level features such as prepared statements, so test the configuration with your framework.
Long transactions and locks
A transaction that stays open holds locks and, in PostgreSQL, prevents cleanup of dead rows. Common culprits are code that opens a transaction and then makes a slow external API call, or sessions left "idle in transaction" by a bug. Keep transactions short, do slow non-database work outside them, and set timeouts so a stuck session cannot block everyone. Watch for deadlocks and lock waits in logs, and keep a consistent order when updating multiple rows or tables.
Caching: Fast, but Easy to Get Wrong
When a query is already efficient but runs constantly, the best optimization is not running it. Caching stores results in fast memory, often Redis or Memcached, or in the application itself.
The most common pattern is cache-aside: the application checks the cache first, falls back to the database on a miss, and stores the result with an expiry time. It works well for data that is read often and changes rarely, such as product details, configuration, and the results of expensive aggregations.
The hard part is invalidation. Cached data can become stale after an update, so decide how fresh each type of data needs to be. Short expiry times are simple and forgiving. Explicit invalidation on writes gives fresher data but requires discipline. Consider stampedes too: when a popular cached item expires, many requests may hit the database at once to rebuild it. Techniques such as staggered expiry, locking the rebuild, or serving slightly stale data while refreshing help.
Treat caching as an addition to good query design, not a replacement. A cache layered on top of an N+1 problem hides the issue until the cache is cold, and then the application slows to a crawl. Plan for the cache being unavailable, since a failure that sends all traffic directly to the database can cause an outage. And never cache sensitive or user-specific data in a shared key without including the user or tenant in the key, since that is both a correctness bug and a security incident waiting to happen.
Scaling the Database
When queries, indexes, and caching are in good shape and the database is still saturated, it is time to scale. The order matters, since scaling an inefficient workload just makes it expensive. As one guide advises, scaling with replicas or sharding should come after exhausting query optimization.
Scale up first
Moving to a larger instance with more CPU, memory, and faster storage is the simplest step and often the right one. More memory lets the database keep more of its working set cached, which can make a bigger difference than extra CPU. In the cloud, also check storage performance: provisioned IOPS and throughput limits, and burstable instance types whose performance drops when credits run out, are frequent hidden causes of slowdowns that look like database problems but are really resource ceilings.
Add read replicas for read-heavy workloads
Replicas copy data from the primary and serve read-only queries, which suits reporting, search, and dashboards. They do not help write-heavy loads. They also introduce replication lag, the delay between a write on the primary and its appearance on a replica. A routing design guide notes that any read that must see the latest write, such as a payment confirmation, has to go to the primary. Design the application so that read-after-write scenarios use the primary, and monitor lag so a struggling replica is taken out of rotation.
Partitioning and sharding
Splitting data across partitions or across separate database servers handles very large datasets and write volumes, but it adds significant complexity: cross-shard queries, rebalancing, and operational overhead. Most applications never need sharding. If you reach that point, treat it as a major architectural project, not a quick fix.
Keep the database close to the application
Network latency between the application and database multiplies with every query. If your application servers and database sit in different regions or availability zones, each round trip costs extra milliseconds, and an N+1 pattern turns that into seconds. Keep them in the same region, and ideally the same zone for latency-sensitive workloads, while balancing that against resilience requirements.
Security Settings and Their Performance Effects
Security and performance are often treated as competing concerns. In databases, the trade-offs are usually small if you plan for them, and ignoring security to chase speed is a poor bargain.
Encrypted connections add a handshake cost, which connection pooling largely hides by reusing established connections. Encryption at rest typically has a modest impact on modern hardware, but test it on your workload. Row-level security policies, which restrict what each user or tenant can see, add conditions to queries, so make sure the columns they reference are indexed. Audit logging records activity for compliance and investigation, but verbose logging of every statement can generate heavy disk writes, so scope it to sensitive tables and actions. Least-privilege roles limit damage from a compromised account, and have no meaningful performance cost.
A final security note relevant to optimization work: query logs and slow query reports can contain sensitive data, since parameters sometimes appear in them. Restrict access to those logs, mask sensitive values where possible, and avoid pasting production queries or data into third-party tools without checking policy.
A Worked Example (Illustrative)
To see how these pieces combine, consider a hypothetical online store whose product listing page takes about 2.4 seconds to respond. The numbers here are invented for illustration and do not come from a real system.
Query logging shows the page runs 63 queries. One fetches 60 products, and 60 more fetch each product's category and primary image separately, which is a classic N+1 pattern. Another filters products by category and price using a query that scans the whole table because no suitable index exists. A third calculates review averages on the fly for every product.
The fixes are straightforward. Eager loading cuts the 63 queries to four. A composite index on category and price removes the table scan. The review average is stored in a column that is updated when reviews change. The listing page, now fast and predictable, gets a short-lived cache for anonymous visitors. Together these changes might bring the response well under the 800-millisecond TTFB guideline, with a lighter load on the database that also makes room for growth.
The point is not the specific numbers. It is the sequence: measure, find the biggest costs, fix queries and indexes first, then cache, and only then scale hardware.
Keeping Performance From Regressing
Optimization is not a one-off project. New features add queries, data grows, and traffic patterns change. A few habits protect your gains.
Monitor the basics continuously: query latency percentiles, slow query counts, connection usage, cache hit rate, replication lag, disk and memory pressure, and lock waits. Set alerts on trends, not just failures. Add query count and timing checks to automated tests for critical endpoints, so an accidental N+1 fails a build instead of reaching production. Review the plans of important queries when schemas or large data sets change. Run schema migrations carefully, using techniques that avoid long table locks, because a blocking migration can look like an outage. And load test before major launches, with realistic data volumes, since a database with a thousand rows tells you nothing about how it behaves with ten million.
Common Mistakes to Avoid
A handful of mistakes account for a large share of avoidable slowness.
Scaling hardware before fixing queries is the costliest. It treats symptoms, raises cloud bills, and postpones the real problem.
Adding indexes without checking plans leads to bloated write performance and indexes that never get used.
Trusting the ORM blindly hides N+1 patterns and oversized queries. Log what it generates.
Ignoring connection limits works until traffic spikes or auto-scaling multiplies connections.
Caching without an invalidation plan serves wrong data, and caching without a failure plan turns a cache outage into a database outage.
Testing only with small data sets hides problems that appear only at scale.
Neglecting maintenance, such as autovacuum health, statistics, and archiving, lets performance decay silently.
Optimizing in production without a safety net, for example running heavy analysis queries on the primary at peak time, can cause the very outage you are trying to prevent.
When to Bring in Specialist Help
Many teams can handle the first rounds of optimization themselves with query logs, plans, and a few indexes. Specialist help becomes worthwhile when performance problems persist despite basic fixes, when you are planning a migration to a managed cloud database, when you face rapid growth that requires architecture changes, or when performance and security requirements, such as compliance auditing or multi-tenant isolation, interact in complicated ways. A good engagement should begin with measurement and end with changes you understand and can maintain, not a pile of configuration tweaks. (Natural internal link opportunities here include your content on cloud infrastructure optimization, managed database services, application performance monitoring, and cloud security reviews.)
Frequently Asked Questions
It reduces the time each request spends waiting on data. Faster queries shorten server response time, which improves Time to First Byte and downstream metrics such as Largest Contentful Paint. It also reduces load on the database, so the application stays fast as traffic grows.
An index lets the database locate matching rows directly instead of scanning every row in the table. The trade-off is slower writes and extra storage, so index the columns your real queries filter, join, and sort on.
It happens when an application runs one query to fetch a list and then an additional query for every item to load related data, producing many small queries instead of a few efficient ones. Eager loading or batching related data fixes it.
Not always. Fix queries and indexes first. Caching is valuable for frequently read, slowly changing data and expensive computations, but it adds complexity around invalidation and failure handling.
When reads dominate your workload and a single primary is saturated, for example with reporting, search, or dashboards. Remember that replicas lag slightly behind the primary, so reads that must reflect a just-completed write should go to the primary.
There is no universal number, since it depends on memory, workload, and database type. In PostgreSQL, large numbers of direct connections degrade performance, so use a connection pooler and keep the number of real connections modest.
Encryption in transit and at rest usually has a modest cost on modern hardware, and pooling reduces handshake overhead. The impact depends on workload, so measure it. The security benefit nearly always outweighs the small performance cost.
Monitor continuously, and review query statistics and plans regularly, such as monthly, and after major releases or data growth. Add automated checks so regressions are caught before they reach users.
Measure. Turn on slow query logging, review query statistics sorted by total time, and examine the plans of the worst offenders. Fixes should target what the data shows, not what looks suspicious.