Aisha Sharma
A successful AI implementation rarely looks like the version in vendor case studies.
There is usually no dramatic transformation and no single breakthrough moment. What you find, when you look closely at projects that worked, is a clearly defined problem, a measured starting point, a narrow first use case, a redesigned workflow, people who know when to trust the output and when to check it, and a way of proving the result in terms the finance team accepts.
This article lays out a framework for understanding what that looks like, and for documenting it. It works in two directions. If you are planning an AI project, it shows you what to put in place so that the project has a chance of ending in a case study worth telling. If you are reading other companies' case studies, or writing your own, it gives you a structure for separating real results from marketing.
The Gap Between Using AI and Getting Value From It
Adoption is no longer the hard part. McKinsey's 2025 State of AI survey, which gathered responses from 1,993 people across 105 countries, found that 88% of organizations use AI regularly in at least one business function, up from 78% the year before. Yet only 39% of respondents said AI had any effect on enterprise-level earnings before interest and taxes, and most of those put the effect below 5%. Roughly 6% qualified as "high performers," meaning they attribute at least 5% of EBIT to AI and report significant value. Nearly two-thirds of organizations had not yet begun scaling AI across the enterprise.
Coverage of McKinsey's 2026 survey describes a similar picture, with the share reporting any EBIT impact little changed at around 37%, though that comes from secondary reporting and the full results are worth reading directly. Other surveys point the same way. BCG's 2025 research on 1,250 executives, as summarized by one analyst, found only 5% of companies generating substantial value at scale, while 60% reported minimal gains. And Deloitte's 2026 enterprise AI report, again as secondarily reported, found only a quarter of respondents had moved 40% or more of their pilots into production.
A few cautions apply. These are self-reported surveys, definitions of "AI use" and "impact" vary, and larger companies, which have more resources to scale, are overrepresented in several of them. Smaller businesses often adopt narrower tools with faster and more modest payback. But the pattern is consistent: using AI is easy, and converting it into measurable business results is not.
That gap is exactly what a good case study framework should illuminate. The difference between the 6% and everyone else is rarely the choice of model. It is how the work was structured around it.
A Six-Lens Framework
A useful way to examine any AI implementation, whether your own or someone else's, is through six lenses. Each answers a question that separates a real result from a demonstration.
- Problem and baseline: What exactly was broken, and what were the numbers before?
- Use case and scope: Why this task, and how narrowly was it defined?
- Data and integration: What did the system need to know, and how did it connect to the work?
- Workflow and people: How did the process change, and what did humans do differently?
- Governance and quality: How were accuracy, risk and compliance handled?
- Results and scaling: What improved, how was it measured, and what happened next?
The sections below take each in turn, describing what success looks like and what to document.
Lens 1: Problem and Baseline
Successful implementations start with a problem a manager would recognize, not a technology. "We want to use generative AI" is a starting point for a demo. "Our support team spends most of its day sorting and routing tickets, and customers wait too long for a first response" is a starting point for a project.
A good problem statement identifies the process, the people affected, the cost of the current approach in time, money, errors or delay, and what better would look like. It also names the constraint that makes the problem hard to fix by simply hiring more people or working harder.
The most underrated element is the baseline. Before changing anything, measure the current state: how long the task takes, how often errors occur, how many items are handled per person per day, how long customers wait, what it costs per transaction. Without a baseline, every later claim of improvement is an impression. McKinsey's analysis notes that benefits often appear at the task level without flowing into financial outcomes, and a baseline is what lets you trace one to the other.
In a case study, this section should include the numbers before the project, the period they cover and how they were gathered. If those details are missing, treat the rest of the story with caution.
Lens 2: Use Case and Scope
The projects that succeed tend to start smaller than the people involved would like. Picking the right first use case is a skill, and a few characteristics make a task a good candidate.
It is frequent enough that savings add up, and consistent enough that patterns exist for a system to learn or follow. It has clear inputs and a recognizable good output, so quality can be checked. It tolerates occasional errors, or at least allows review before errors reach customers. It involves information that is accessible in digital form. And it matters to someone with the authority to change the process.
Common strong starting points include sorting and routing incoming requests, extracting data from documents, drafting first-pass responses for human review, summarizing long records, searching internal knowledge, and flagging exceptions in routine transactions. Tasks that involve high-stakes judgment, unclear success criteria or little available data are poorer first choices, however attractive they look in a presentation.
Scope matters as much as selection. A successful project defines what the system will do and what it will not. "Draft replies to the five most common billing questions for agent review" is a scope. "Improve customer service with AI" is an ambition. In the case study, record the original scope, any changes made along the way and the reasons.
Lens 3: Data, Systems and Integration
An AI tool disconnected from the systems where work happens produces impressive demos and little else. Look for how the solution obtains the information it needs and how its output enters the process.
On the data side, the questions are practical. Where does the relevant information live, and is it in a usable state? Is it accurate, current and consistent? Who owns it, and what are the permissions? Many projects discover at this stage that the real work is cleaning up scattered documents, outdated records or unclear definitions. That is not a failure. It is a finding, and successful teams budget time for it.
On the integration side, success usually means the AI step sits inside the tools people already use: the ticketing system, the CRM, the accounting package, the document repository. Asking staff to copy information into a separate chat window, and paste the results back, creates friction that erodes adoption. Document which systems were connected, how, and who maintains the connection.
Also note security and privacy decisions made here: what data the system can see, where it is processed, whether it is retained, and whether it is used to train anything. These choices shape what is acceptable for customer or regulated information.
Lens 4: Workflow and the Human Role
This is the lens that most clearly separates results from pilots. McKinsey's research found that high-performing organizations were nearly three times as likely to have fundamentally redesigned individual workflows, and described workflow redesign as one of the strongest contributors to bottom-line impact among the factors tested.
The reason is simple. Dropping an AI tool into an unchanged process usually speeds up one step while leaving the rest as it was. The saved minutes disappear into waiting, handoffs and rework. Real gains come from rethinking the sequence: which steps disappear, which move earlier, which are handled automatically, which need a person and what that person should focus on.
A strong case study describes the before and after of the process in concrete terms. Who did what, in what order, before? Who does what now? What decisions remain human? What happens when the system is uncertain? What do the people involved say about it?
The human role deserves particular attention. In successful implementations, people are not simply replaced or sidelined. They shift toward review, exceptions, relationships and judgment, and they receive training to do it well. Where roles are changing, the case study should say how that was communicated and handled, since resistance is a common reason for projects to stall. Where AI reduces workload, say what happened to the time freed up, because that connects directly to whether financial benefits appear.
Lens 5: Governance, Accuracy and Risk
AI systems make mistakes, and sometimes they make them confidently. A successful implementation does not pretend otherwise. It treats quality and risk as design questions, from the start.
Look for these elements. A defined standard for "good." The team decided in advance what accuracy was acceptable and how to measure it, ideally using a set of real examples with known correct answers that the system is tested against before launch and periodically afterward. Human checkpoints in proportion to risk. Low-risk outputs may be sent automatically, while higher-risk ones are routed to a person, often based on confidence levels or categories. Monitoring after launch. Performance drifts as data, products and customer behavior change, so someone watches the results and has authority to adjust or pause the system. Clear accountability. A named owner is responsible for the system's behavior. Data protection and compliance. Privacy, security and sector rules were considered at the design stage, not after complaints.
External frameworks can help structure this. The NIST AI Risk Management Framework offers a widely used vocabulary for identifying and managing AI risks, and ISO/IEC 42001 provides a management system standard for AI governance. Neither is mandatory for most businesses, but both are useful references for what a mature approach includes.
Regulation is part of the picture too, though the timing is in flux. The EU AI Act's obligations for high-risk systems were originally due to apply from August 2026. In May 2026, EU legislators reached a provisional agreement to postpone them, to 2 December 2027 for stand-alone high-risk systems and 2 August 2028 for those embedded in regulated products, subject to formal adoption. The agreement leaves the risk-based structure and the rules on prohibited practices and general-purpose models unchanged, and transparency duties under Article 50 were not part of the delay. If you operate in or serve the EU, verify the current status with legal advisers. Whatever the deadlines, building good governance now is cheaper than retrofitting it.
Lens 6: Results, Measurement and Scaling
This is where case studies are most often weak. The claim "AI improved efficiency" is not a result. A result has a baseline, a comparison, a period and a method.
Strong measurement follows a chain. It starts with activity and quality metrics: items processed, time per item, error rates, rework, first-response time, customer satisfaction. It then asks whether those changes translated into capacity or cost changes: fewer overtime hours, work absorbed without hiring, faster cycle times, reduced backlog. And finally it connects to financial or strategic outcomes: cost per transaction, revenue retained or gained, margin, avoided cost.
The middle step is where value often leaks. Time saved is not money saved until something changes because of it. If staff save five hours a week and nothing is done with those hours, the organization has gained comfort, not cash. Analysis of McKinsey's recent surveys makes the same point: improvements at the individual or task level, which about 80% of respondents report as productivity gains, do not flow into EBIT unless saved time is turned into reduced cost or increased output. A credible case study explains which of those happened.
Include the costs too. A fair account counts licenses, usage fees, integration work, internal staff time, training, ongoing monitoring and maintenance, not only the savings. Usage-based pricing, common with AI services, can make costs rise with success, so note how spending scales.
Finally, address scaling. Did the project move from a pilot to regular operation? Was it extended to other teams, languages or processes? What had to change, such as data access, support, or governance, to make that possible? And what did the team learn that affected the next project? The sign of a successful implementation is often that it becomes the template for the second one.
What the Timeline Usually Looks Like
Every project differs, but successful ones tend to move through recognizable phases, and a case study should show them honestly, including setbacks.
The discovery phase, often a few weeks, covers choosing the problem, measuring the baseline, assessing data and agreeing on success criteria. The pilot phase, often one to three months, builds a narrow version with real users and real data, tests it against a prepared set of examples and collects feedback. The hardening phase turns the pilot into something reliable: integrations, security review, monitoring, training, documentation and fallback procedures. The rollout and optimization phase expands usage, tracks results against the baseline and tunes the system. The scaling phase applies the lessons to further use cases.
These durations are typical ranges rather than rules, and they vary with complexity, data readiness and organizational pace. Be suspicious of any story that moves from idea to enterprise-wide transformation in a few weeks without mentioning data work, testing or change management. Equally, a pilot that lingers for a year without a decision on whether to proceed is a warning sign in itself.
How to Write the Case Study Itself
Whether the case study is for internal learning, a board update or public marketing, a consistent structure makes it more useful and more credible. The six lenses translate directly into sections.
Open with a short summary: the organization type, the problem, what was done and the headline result with its baseline. Then cover the situation before the project, including the baseline metrics and why the problem mattered. Describe the use case and scope, including what was deliberately left out. Explain the data and systems involved, and how the solution fit into existing tools. Walk through the redesigned workflow and the role of people. Describe how quality, risk and compliance were managed. Present the results with the measurement method, the time period and the costs. Close with lessons learned and next steps.
A few habits make the difference between a convincing case study and a brochure.
Include what went wrong. Every real project has setbacks: data that was messier than expected, a first version that disappointed users, a requirement that changed. Describing them, and what was done, builds trust and teaches readers something.
Be precise about numbers. State the baseline, the comparison and the period. Say whether figures are measured or estimated. Avoid rounding up to impressive-sounding percentages.
Separate the tool from the result. Readers learn more from how the process was changed than from the name of the product.
Get the people's perspective. Quotes from those who use the system daily, with their permission, reveal adoption and trust far better than managerial summaries.
Note limitations. Say what the system does not do well, and what conditions the results depend on. A result achieved with unusually clean data, or an unusually motivated team, may not travel.
Get approvals. Check confidentiality, customer consent and data-sharing permissions before publishing details.
An Illustration: What the Framework Looks Like in Practice
The following is a hypothetical example, not a real company, included to show how the lenses fit together.
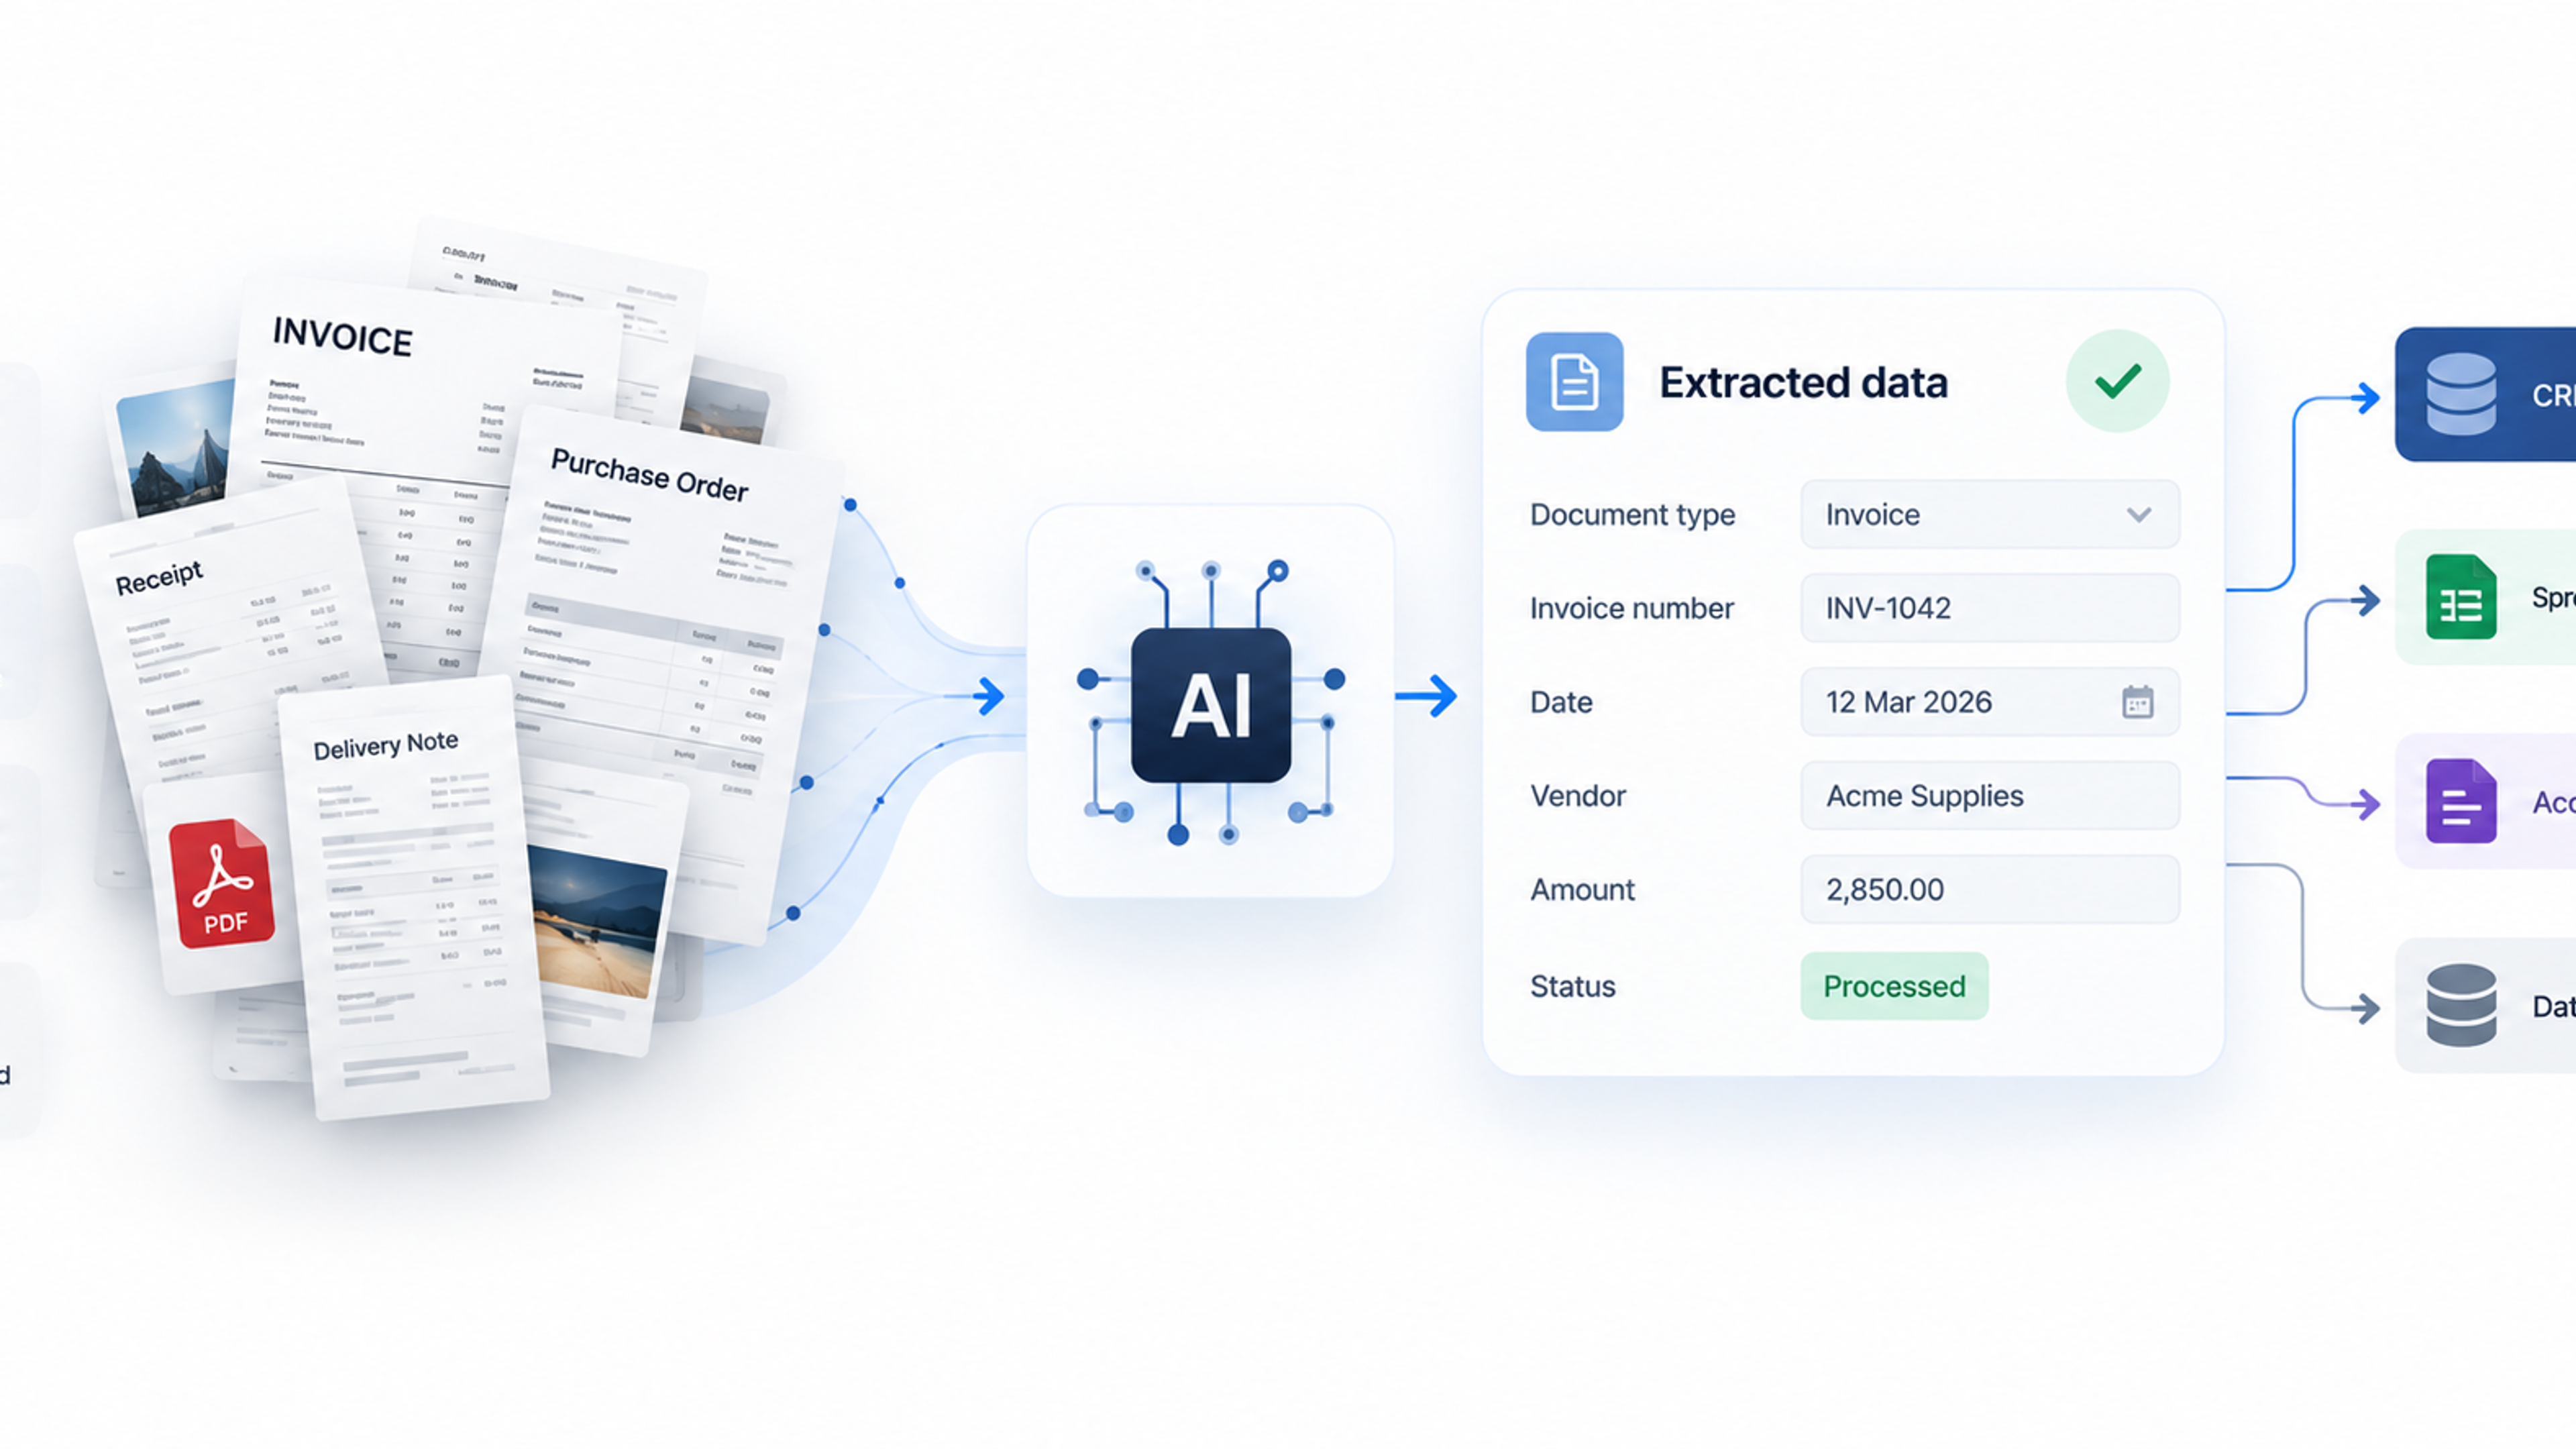
Imagine a regional distributor whose accounts team spends much of each week matching supplier invoices to purchase orders and resolving mismatches. The problem is slow payment cycles and staff frustration, and the team measures that each invoice takes a certain number of minutes of handling and that a significant share arrive with discrepancies. That measurement is the baseline.
For the use case, the team chooses invoice data extraction and matching for the top handful of suppliers only, leaving unusual invoices to staff. The data and integration work reveals that purchase order records are inconsistent, so cleaning them becomes part of the project, and the extracted data is fed directly into the accounting system.
In the workflow redesign, clean matches post automatically, minor mismatches go to a clerk with the system's suggested resolution, and unusual cases follow the old route. Clerks shift from keying data to resolving exceptions and contacting suppliers. For governance, the team tests the system against a set of past invoices with known answers before launch, samples automatically posted invoices each week and names an owner who can pause automation.
For results, they compare handling time and error rates with the baseline over a set period, count the costs of the software and project time, and decide what to do with the capacity released: absorbing growth without hiring and shortening the payment cycle. They then extend the approach to more suppliers.
Nothing in that story is glamorous. That is the point. The success came from structure, measurement and process change, with the technology as one component.
How to Read Someone Else's AI Case Study
When you are evaluating vendors or looking for inspiration, apply the same lenses as a filter. Be wary when a case study:
- Gives results with no baseline or time period
- Describes the technology at length and the workflow not at all
- Cites only the best outcome without any mention of cost, effort or difficulties
- Uses unexplained percentages such as "up to 80% faster"
- Comes from a company in a very different size, data situation or industry from yours
- Describes a pilot as if it were enterprise-wide operation
- Contains no voices from the people doing the work
None of these makes a case study false, and vendors can have genuine successes. But each is a prompt to ask for the missing details, ideally in a conversation with a reference customer who can speak freely.
Common Reasons Implementations Stall
The failure patterns echo the framework. Projects start with a technology and look for a problem, so there is no baseline and no clear value. The first use case is too ambitious or poorly scoped. Data turns out to be scattered, outdated or inaccessible. The tool sits outside normal systems, so adoption fades. The process is unchanged, so time savings vanish. Quality is not measured, so trust erodes after a visible error. No one owns the system after launch. Benefits are never tied to financial outcomes, so executives lose interest. Or the pilot succeeds in a controlled setting and never gets the funding, integration or support to reach production.
Almost all of these are management and design problems, not technical limits. That is encouraging, because they are solvable with planning and discipline.
Where This Fits in Your Wider Automation Strategy
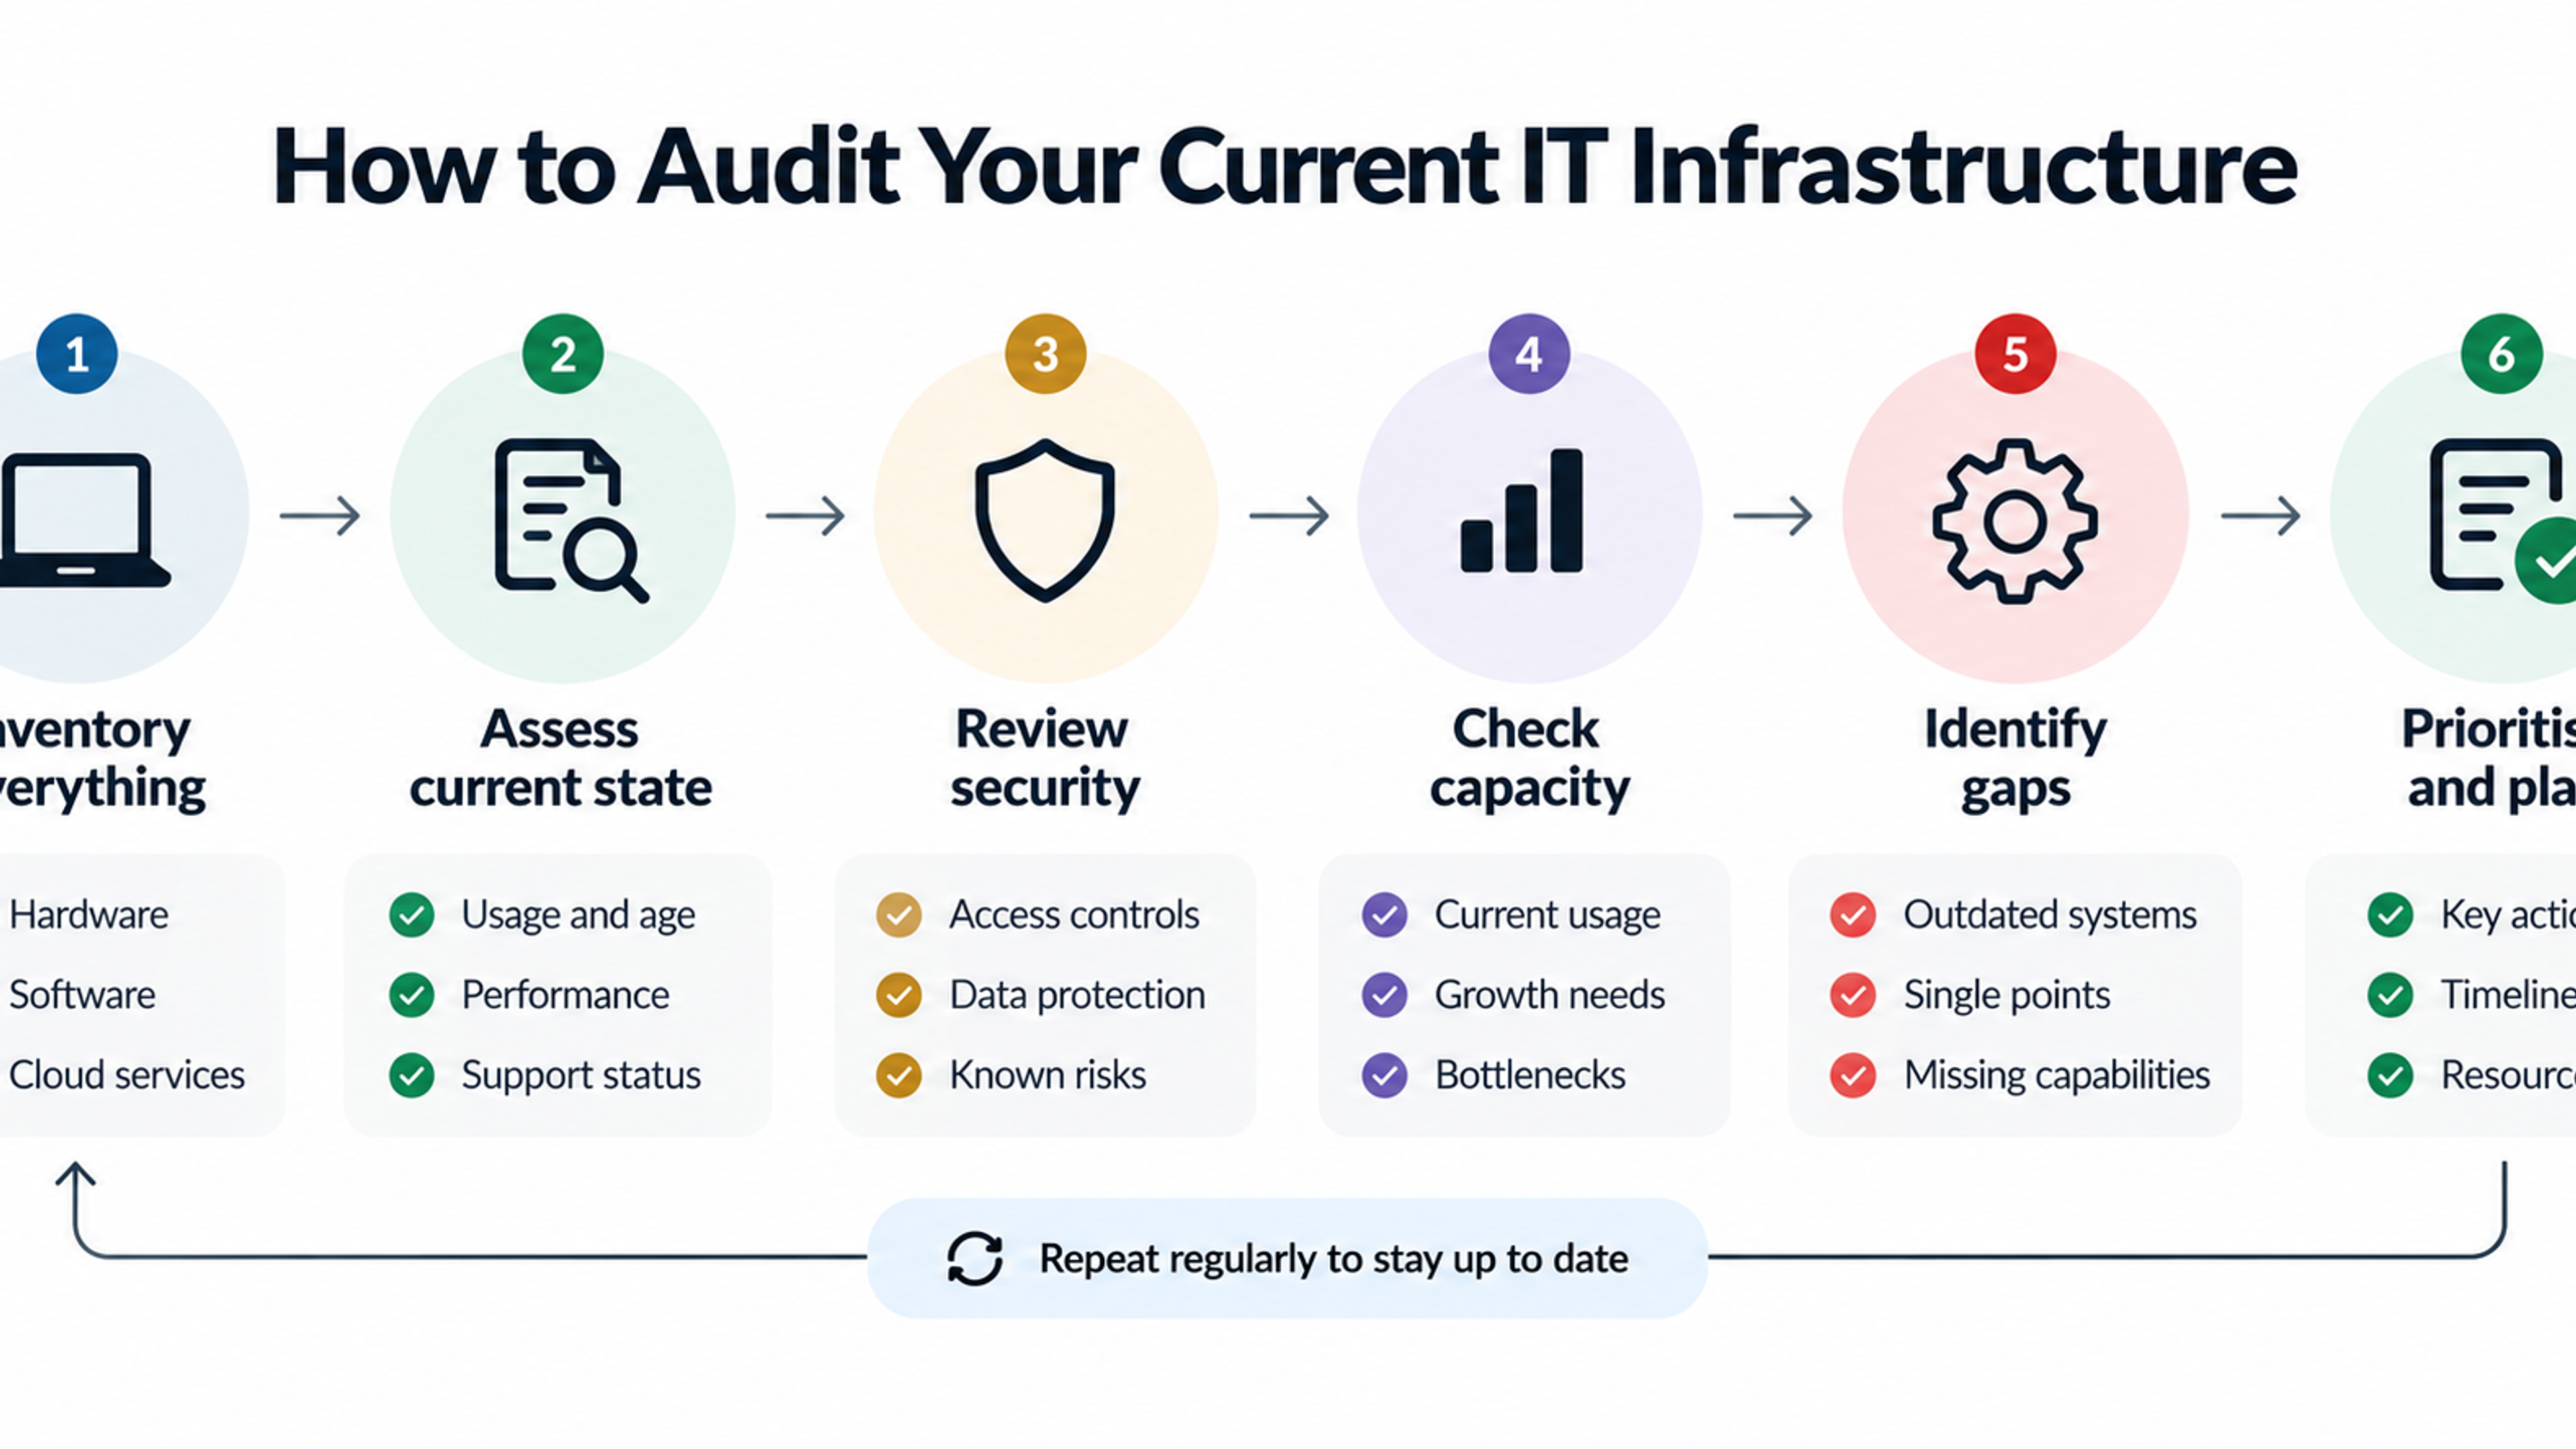
A case study framework is most useful when it becomes a habit rather than a one-off document. Organizations that scale AI well tend to keep a simple register of use cases, each with its baseline, owner, status and results, and to review it regularly. That register makes it easy to see which projects delivered, which should be stopped and where to invest next.
It also supports better buying decisions. When you know what a successful implementation looks like in your own business, you can ask vendors and partners sharper questions, and recognize the ones who can answer them. For many businesses, this is where outside expertise helps most: not in choosing a model, but in structuring the problem, redesigning the process and setting up the measurement.
Frequently Asked Questions
It starts with a defined business problem and a measured baseline, uses a narrow and well-scoped first use case, connects to existing systems, redesigns the workflow around the technology, manages quality and risk with human oversight and monitoring, and demonstrates results in terms of cost, capacity or revenue against the original baseline.
Structure it around the problem and baseline, the use case and scope, the data and systems involved, the redesigned workflow and the role of people, how quality and risk were managed, the results with method and costs, and lessons learned. Include what went wrong and the limits of the results.
Surveys suggest adoption is widespread, but only a minority report enterprise-level financial impact. Common causes include unclear problems, poor data, tools disconnected from workflows, unchanged processes, missing measurement and lack of ownership. McKinsey's research highlights workflow redesign as a major differentiator.
Look for a frequent, repetitive task with clear inputs and outputs, where errors can be caught before they matter. Examples include sorting customer enquiries, extracting data from documents, drafting routine replies for review and searching internal documents.
A narrow pilot can take weeks to a few months, while hardening and rollout often take longer, depending on data readiness, integrations and organizational change. Be cautious of timelines that skip data preparation, testing or training.
They are not required for most businesses, but they offer useful structures for managing AI risk and governance. Legal requirements, such as the EU AI Act for those in scope, are separate and should be checked with qualified advisers.
A pilot tests feasibility with limited scope and often with extra attention from the project team. A production implementation runs in regular operations, integrated with systems, supported by monitoring, training, security controls and clear ownership. Many projects stall in the gap between the two.
Check for a baseline, a stated time period, a measurement method, a description of the workflow changes, mention of costs and difficulties, and the voice of actual users. Ask whether a similar customer can be contacted for a reference.
Measure a baseline before starting, then track task-level metrics such as time, accuracy and volume, translate them into capacity or cost changes, and connect those to financial outcomes. Include all costs, such as licenses, usage fees, integration, training and ongoing maintenance, and note what was done with any time freed up.